anko package
Submodules
anko.anomaly_detector module
-
class
anko.anomaly_detector.AnomalyDetector(t, series)[source]¶ Bases:
object-
apply_policies¶ Policies for AnomalyDetector to follow with.
- Parameters
scaleless_t (bool, default True) – If True, use numpy.arange(1, len(t)+1) for the fitting.
boxcox (bool, default False) – If True, perform log-boxcox transformation before carrying out normal test. This will result in higher chances on selecting normal distribution method.
z_normalization (bool, default True) – If True, apply z-score normalization to fitting residual. This parameter is stringly advised to define threshold values in AnomalyDetector.thres_params scalelessly.
info_criterion (str, default 'AIC') – Information criterion for selecting fitting ansatzs, allowed fields are ‘AIC’ or ‘BIC’.
abs_residual (bool, default False) – If True, return absolute value of residual.
full_return (bool, default True) – If True, return named dictionary for fitting parameters, eilse return list of fitting parameters in the order that can be found in AnomalyDetector.models.
min_sample_size (int, default 10) – Minimum number of data samples to execute AnomalyDetector. If provided number of samples is less than this attribute, raise ValueError.
- Type
-
thres_params¶ Threshold values for selecting anomalous data.
- Parameters
p_normality (float, default 5e-3) – Threshold value for selecting normal distribution, in accordance with the p value of normal test.
normal_err (float, default 75) – Threshold value for selecting normal distribution, in case that fitting on normal distribution failed and unconverged.
normal_std_width (float, default 1.5) – Threshold width of standard deviation, data points exceed this param will be regarded as anomalous.
normal_std_err (float, default 1e+1) – Maximum tolerence of convergence. If fitting error is larger than this param, pass ConvergenceError to CheckResult.extra_info.
linregress_std_err (float, default 1e+1) – Maximum tolerence of convergence. If fitting error is larger than this param, pass ConvergenceError to CheckResult.extra_info.
linregress_res (float, default 2) – Threshold value of residual for linear regression, data points exceed this param will be regarded as anomalous.
step_func_err (float, default 1e+1) – Maximum tolerence of convergence. If fitting error is larger than this param, pass ConvergenceError to CheckResult.extra_info.
step_func_res (float, default 2.5) – Threshold value of residual for general sign function, data points exceed this param will be regarded as anomalous.
exp_decay_err (float, default 1e+1) – Maximum tolerence of convergence. If fitting error is larger than this param, pass ConvergenceError to CheckResult.extra_info.
exp_decay_res (float, default 2) – Threshold value of residual for exponential function, data points exceed this param will be regarded as anomalous.
skewness (float, default 20) – Threshold value of skewness. If skewness of data distribution is larger than this param, pass Warning to CheckResult.extra_info.
min_res (float, default 10) – Absolute minimum value of residul, residuals that are smaller than this param will be masked into zero. This action is always performed before z-score normalizing the residual.
- Type
-
models¶ Models that can be considered by AnomalyDetector.
- Gaussian (Normal) Distribution
- Linear Regression

- Step Function
- Exponential Decay
- Parameters
gaussian (bool, default True) – Gaussian (normal) distribution. Define in stats_util.normal_distr.
half_gaussian (bool, default False) – In development, unavailable for now.
linear_regression (bool, default True) – Linear ansatz.
step_func (bool, default True) – Generalize Heaviside step function. Define in stats_util.general_sgn.
exp_decay (bool, default True) – Exponential function. Define in stats_util.exp_decay.
- Type
-
anko.stats_util module
-
anko.stats_util.AIC_score(y: numpy.ndarray, y_predict: numpy.ndarray, p: int) → float[source]¶ Compute Akaike information criterion for model selection.

where
 is the residual sum of squares, and
  is the number of data samples.
-
anko.stats_util.BIC_score(y: numpy.ndarray, y_predict: numpy.ndarray, p: int) → float[source]¶ Compute Bayesian information criterion for model selection.

where
is the residual sum of squares, and is the number of data samples.
-
anko.stats_util.DBSCAN(x: numpy.ndarray, eps: float = 0.9, min_samples: int = 5)[source]¶ Perform Density-Based Spatial Clustering of Applications with Noise algorithm for anomaly detection. This function is a wrapper of scikit.cluster.DBSCAN.
- Parameters
x (numpy.ndarray) – Input values.
eps (float, oprtional) – The maximum distance between two samples for one to be considered as in the neighborhood of the other. Please also note that eps is defined in the unit of median absolute deviation, namely
 .
This is not a maximum bound on the distances of points within a cluster.
This is the most important DBSCAN parameter to choose appropriately for your data set and distance function.
.
This is not a maximum bound on the distances of points within a cluster.
This is the most important DBSCAN parameter to choose appropriately for your data set and distance function.min_samples (int, optional) – The number of samples (or total weight) in a neighborhood for a point to be considered as a core point. This includes the point itself.
- Returns
out (dict):
- Return type
-
anko.stats_util.data_is_linear(x: numpy.ndarray, y: numpy.ndarray, std_err_th: float = 0.01) → bool[source]¶ Check whether the data (x, y) is linear under the given tolerance.
This will perform a linear regression fitting.
-
anko.stats_util.discontinuous_idx(x: numpy.ndarray, std_width: int = 1)[source]¶ Compute derivative of input array x, and organize the result into z-score standardized formulation. Once this analysis is done, normalized results are masked for those magnitudes that are smaller than std_width, in order to ignore noises.
- Parameters
x (numpy.ndarray) – Input Values.
std_width (int) – Threshold values for masking noises.
- Returns
idx (numpy.ndarray): Indices of discontinuous points in input array x.
- Return type
numpy.ndarray
-
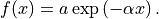
anko.stats_util.exp_decay(x: numpy.ndarray, a: float, alpha: float) → numpy.ndarray[source]¶ Calculate the exponential function of input array x. Note that domain of x >= 0.
-
anko.stats_util.exp_decay_fit(x: numpy.ndarray, y: numpy.ndarray, mode: str = 'log-linregress', maxfev: int = 2000, bounds=[-1e-06, 1000000.0])[source]¶ - Parameters
- Returns
popt (numpy.ndarray): perr (numpy.ndarray):
- Return type
 scale,
else brutal force
scale,
else brutal force-
anko.stats_util.fitting_residual(x: numpy.ndarray, y: numpy.ndarray, func, args, mask_min: float = None, standardized: bool = False) → numpy.ndarray[source]¶ Compute the fitting residual.
- Parameters
x (numpy.ndarray) – x coordinate of input data points.
y (numpy.ndarray) – y coordinate of input data points.
func (callable) – Fitting function.
args (numpy.ndarray) – Best estimated arguments of fitting function.
mask_min (float, optional) – If not None, mask resuduals that are smaller than mask_min to zero. This is always performed before standardization.
standardized (bool, optional) – Standardize residual to z-score formalism.
- Returns
res (numpy.ndarray): Residual of each corresponding data points (x, y).
- Return type
numpy.ndarray
-
anko.stats_util.flat_histogram(x: numpy.ndarray)[source]¶ Deprecating…
Manually assign parameters of Gaussian distrinution if the given histogram is too flat.
In this senario the histogram of data is regarded as a local segment of a larger normal-distribution-like histogram, with standard deviation which exceeds the current consideration of domain.
- Parameters of Gaussian distribution are assigned as following:
Number of appearance of mode as normalization constant, a.
Mode of data x as mean, x0.
Standard deviation is set to infinity (numpy.inf).
- Parameters
x (numpy.ndarray) – Input values.
- Returns
- popt (numpy.ndarray):
Assigned values for Gaussian distribution.
- perr (numpy.ndarray):
Errors are set to zero.
- Return type
-
anko.stats_util.gaussian_fit(x: numpy.ndarray, binning: str = 'auto', half: str = None, maxfev: int = 2000, bounds=[0, 1000000.0])[source]¶ Fitting the Gaussian (normal) distribution for input data x.
- Parameters
- Returns
- popt (numpy.ndarray):
Estimate value of a, x0 and sigma of Gaussian distribution.
- perr (numpy.ndarray):
Error of popt. Defined by the square of diagonal element of covariance matrix.
- Return type
-
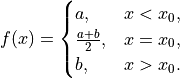
anko.stats_util.general_sgn(x: numpy.ndarray, a: float, b: float, x0: float) → numpy.ndarray[source]¶ Calculate the generalize sign function of input array x.
-
anko.stats_util.general_sgn_fit(x: numpy.ndarray, y: numpy.ndarray, three_stair: bool = False, maxfev: int = 2000, bounds=[0, 1000000.0])[source]¶ Fitting generalize sign function for input data (x, y).
- Parameters
- Returns
popt (numpy.ndarray): perr (numpy.ndarray):
- Return type
-
anko.stats_util.get_histogram(x: numpy.ndarray, binning: str = 'auto')[source]¶ Return the corresponding histogram of the data x. This will perform binning on data.
- Parameters
x (numpy.ndarray) – One-dimensional array of data.
binning (str, optional) – Binning methods, default ‘auto’. If None, return the naive counting number of appearence without binning as hist, else please refer to numpy.histogram_bin_edges for further binning methods.
- Returns
- bins (numpy.ndarray):
Center position of bins.
- hist (numpy.ndarray):
Histogram of x, with same size as bins.
- Return type
-
anko.stats_util.is_oscillating(x: numpy.ndarray, osci_freq_th: float = 0.3) → bool[source]¶ Determine whether the input array x is oscillating over its mean with frequency larger than osci_freq_th.
This is equivalent to find the number of solutions of the following equation

-
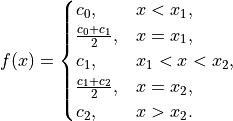
anko.stats_util.left_half_normal_distr(x: numpy.ndarray, a: float, x0: float, sigma: float) → numpy.ndarray[source]¶ Calculate left-side half normal distribution of input array x.
-
anko.stats_util.linear_regression(x: numpy.ndarray, y: numpy.ndarray)[source]¶ Fitting linear ansatz for input data (x, y).
- Parameters
x (numpy.ndarray) – x coordinate of input data points.
y (numpy.ndarray) – y coordinate of input data points.
- Returns
- r_sq (float):
Coefficient of determination.
- intercept (float):
Intercept of the regression line.
- slope (float):
Slope of the regression line.
- p_value (float):
Two-sided p-value for a hypothesis test whose null hypothesis is that the slope is zero, n using Wald Test with t-distribution of the test statistic.
- std_err (float):
Standard error of the estimated gradient.
- Return type
-
anko.stats_util.median_absolute_deviation(x: numpy.ndarray) → numpy.ndarray[source]¶ Calculate the median absolute deviation. The is a robust statistical measurement defined by

- Parameters
x (numpy.ndarray) – Input values.
- Returns
med (numpy.ndarray): Output array.
- Return type
numpy.ndarray
-
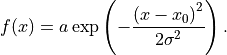
anko.stats_util.normal_distr(x: numpy.ndarray, a: float, x0: float, sigma: float) → numpy.ndarray[source]¶ Calculate normal distribution of input array x.
-
anko.stats_util.right_half_normal_distr(x: numpy.ndarray, a: float, x0: float, sigma: float) → numpy.ndarray[source]¶ Calculate right-side half normal distribution of input array x.
-
anko.stats_util.smoothness(x: numpy.ndarray, normalize: bool = False)[source]¶ - Parameters
x (numpy.ndarray) –
normalize (bool) –
- Returns
sm (numpy.ndarray):
- Return type
numpy.ndarray